
11 great tools to use in Linux's terminal
11 great tools to use in Linux's terminal
The Linux terminal offers powerful tools to simplify system monitoring, navigation, and management. Here's a quick look at 11 must-have tools for Linux users:
- zoxide: Quickly navigate directories with smart shortcuts.
- bandwhich: Monitor per-process network bandwidth in real-time.
- bpytop: Visualize CPU, memory, disk, and network usage interactively.
- Glances: Lightweight system performance monitoring.
- gping: Visualize ping responses as live ASCII charts.
- dua-cli: Analyze disk usage and identify large files.
- speedtest-cli: Test internet speed directly from the terminal.
- rclone: Manage and sync files across multiple cloud storage providers.
- asciinema: Record and share terminal sessions.
- goaccess: Analyze web server logs in real-time.
- aria2: Boost download speeds with segmented downloads.
These tools are designed to improve productivity, simplify tasks, and provide detailed insights into your system's performance - all from the terminal. Whether you're a system administrator or a developer, these utilities can enhance your Linux experience.
Quick Comparison Table
| Tool | Primary Function | Key Features |
|---|---|---|
| zoxide | Smart directory navigation | Fuzzy matching, interactive menu |
| bandwhich | Network bandwidth monitoring | Per-process stats, reverse DNS lookups |
| bpytop | System resource visualization | Interactive, mouse-friendly interface |
| Glances | System performance monitoring | Lightweight, real-time metrics |
| gping | Ping visualization | ASCII charts for latency trends |
| dua-cli | Disk usage analysis | Clear output of largest files/directories |
| speedtest-cli | Internet speed testing | Simple text output, JSON logging |
| rclone | Cloud storage management | Multi-provider sync, encryption, FUSE mount |
| asciinema | Terminal session recording | Lightweight, shareable text-based recordings |
| goaccess | Web server log analysis | Real-time HTML reports, geo-location lookup |
| aria2 | Download management | Multi-source downloads, protocol support |
These tools are easy to install and integrate into your workflow. Start using them today to unlock the full potential of the Linux terminal.
1. zoxide: Smarter Directory Navigation
zoxide is an upgrade to the traditional cd command. It uses a ranking system that learns your habits, so you can quickly jump to your most-used directories with fewer keystrokes.
For example, instead of typing this long path:
cd /home/user/projects/logcentral/backend/config
you can just type:
z config
zoxide will figure out which directory you mean based on your history.
Key Features
- Partial matching: For example,
z log backtakes you to/home/user/projects/logcentral/backend, the top-ranked match. - Subdirectory targeting: Typing
z config/jumps to the closest "config" folder. - Interactive menu: Use
zi projto open a menu (powered byfzf) for selecting directories.
How to Set Up
Run this command to install:
curl -sSfL https://raw.githubusercontent.com/ajeetdsouza/zoxide/main/install.sh | sh
eval "$(zoxide init bash)"
- To exclude specific paths, configure
_ZO_EXCLUDE_DIRS. - Install
fzffor fuzzy directory selection.
Coming up: Learn how to monitor per-process network bandwidth in real time with bandwhich.
2. bandwhich: Network Usage Monitor
bandwhich provides real-time bandwidth statistics for each process, connection, and remote host. It monitors per-process usage, active connections, and remote IPs (including reverse-DNS names).
To get started, install it through your distribution package manager or from the source, then set the required permissions with:
sudo setcap cap_net_raw,cap_net_admin=eip $(which bandwhich)
Key Features:
- Adjusts to fit your terminal size
- Displays bandwidth usage by process, connection, and remote host
- Performs automatic reverse DNS lookups
- Useful for identifying bandwidth-heavy processes, connected clients, or unusual IPs on busy servers
bandwhich works by mapping packets to processes using /proc and resolving IP addresses via reverse DNS [1].
For a complete monitoring setup, combine bandwhich with LogCentral. Use bandwhich to detect anomalies in real time, then dive deeper into root causes with LogCentral.
Next, bpytop offers detailed insights into CPU, memory, disk, and network performance.
3. bpytop: System Resource Viewer
bpytop offers a real-time, interactive way to monitor your system's performance. It provides detailed insights into CPU, memory, disk, and network usage, all displayed in a visually engaging, game-like interface.
This Python-based tool shows live graphs for CPU, memory, swap, disk I/O, and network activity, along with a detailed list of running processes. The interface is fully mouse-friendly, making navigation smooth and intuitive. You can filter and sort processes, send signals like SIGTERM, SIGKILL, or SIGINT, and even check stats for individual processes.
To use bpytop, you'll need Python 3.7 or newer, psutil 5.7 or newer, and a UTF-8-compatible terminal. Its configuration is stored in ~/.config/bpytop, and it supports themes from bashtop. Plus, it notifies you about updates - a handy feature for system administrators.
For complete system monitoring, pair bpytop's live metrics with LogCentral's log analysis tools. This combination gives you a comprehensive view of your system's performance.
4. Glances: System Performance Monitor
Glances offers a straightforward way to monitor system performance, focusing on the most important metrics. Unlike bpytop's interactive, game-like interface, Glances provides a simple, real-time view of key data like CPU load, memory usage, disk I/O, and network I/O. Its terminal-based interface is clean and easy to navigate.
You can install Glances on individual hosts and integrate its real-time metrics with LogCentral. This setup allows you to combine live data with historical logs, making it easier to detect anomalies and resolve issues efficiently.
5. gping: Visual Ping Tool
gping turns ping output into a live ASCII chart, making it easy to spot latency spikes, drops, and trends in real time. To install it, you can use:
sudo apt install gping # or cargo install gping
Once installed, try running the following command:
gping google.com
Pair gping with tools like LogCentral to link latency issues with system logs more effectively. Afterward, you can dive into disk usage insights using dua-cli.
6. dua-cli: Disk Usage Analyzer
With dua-cli, you can instantly see your largest files and directories. Its clear output makes it easy to identify what's taking up space. You can even pipe the results into tools like LogCentral to monitor disk usage over time and link sudden changes to specific system events. For a complete picture, pair it with speedtest-cli to measure your network bandwidth.
7. speedtest-cli: Internet Speed Tester
You can check your network's performance using speedtest-cli, a command-line tool for Speedtest.net[1]. It's especially useful for remote systems or headless setups.
To automate testing, set up a cron job like this:
0 */4 * * * /usr/local/bin/speedtest-cli --json >> /var/log/speedtest.log
This example runs every four hours, logging the results (download/upload speeds in Mbps, ping in ms) as JSON data into /var/log/speedtest.log. You can then analyze the data with tools like LogCentral to monitor trends, identify slowdowns, or troubleshoot issues. Keep in mind that each test uses actual bandwidth, so plan the schedule accordingly.
For a simpler output, try this:
speedtest-cli --simple > network_speed.log
This provides a quick summary that you can process with shell scripts or combine with dua-cli to get a clearer picture of both network and disk performance.
References: [1] speedtest-cli GitHub repository: a command-line interface for Speedtest.net.
8. rclone: Cloud Storage Manager
Once you've tested your network speed with speedtest-cli, it's time to simplify your file backups using rclone. This tool lets you automate cloud backups and syncs directly from your terminal. Here's what makes it stand out:
- Supports Multiple Cloud Providers: Sync files across 40+ providers like Google Drive, S3, and Dropbox.
- Data Encryption: Protect sensitive information with built-in encryption, helping meet GDPR requirements.
- Mount Cloud Storage: Use FUSE to access your cloud storage as if it were a local filesystem.
With rclone, you can easily transfer data to and from most major cloud platforms. To get started, install it with the following command:
curl https://rclone.org/install.sh | sudo bash
Then, sync your files with a simple command:
rclone sync /local/path remote:backup --progress
For tracking and auditing purposes, LogCentral can monitor rclone's verbose output, making it a great choice for managing backups across your systems. Coming up next: learn how to record and share terminal sessions using asciinema.
9. asciinema: Terminal Session Recorder
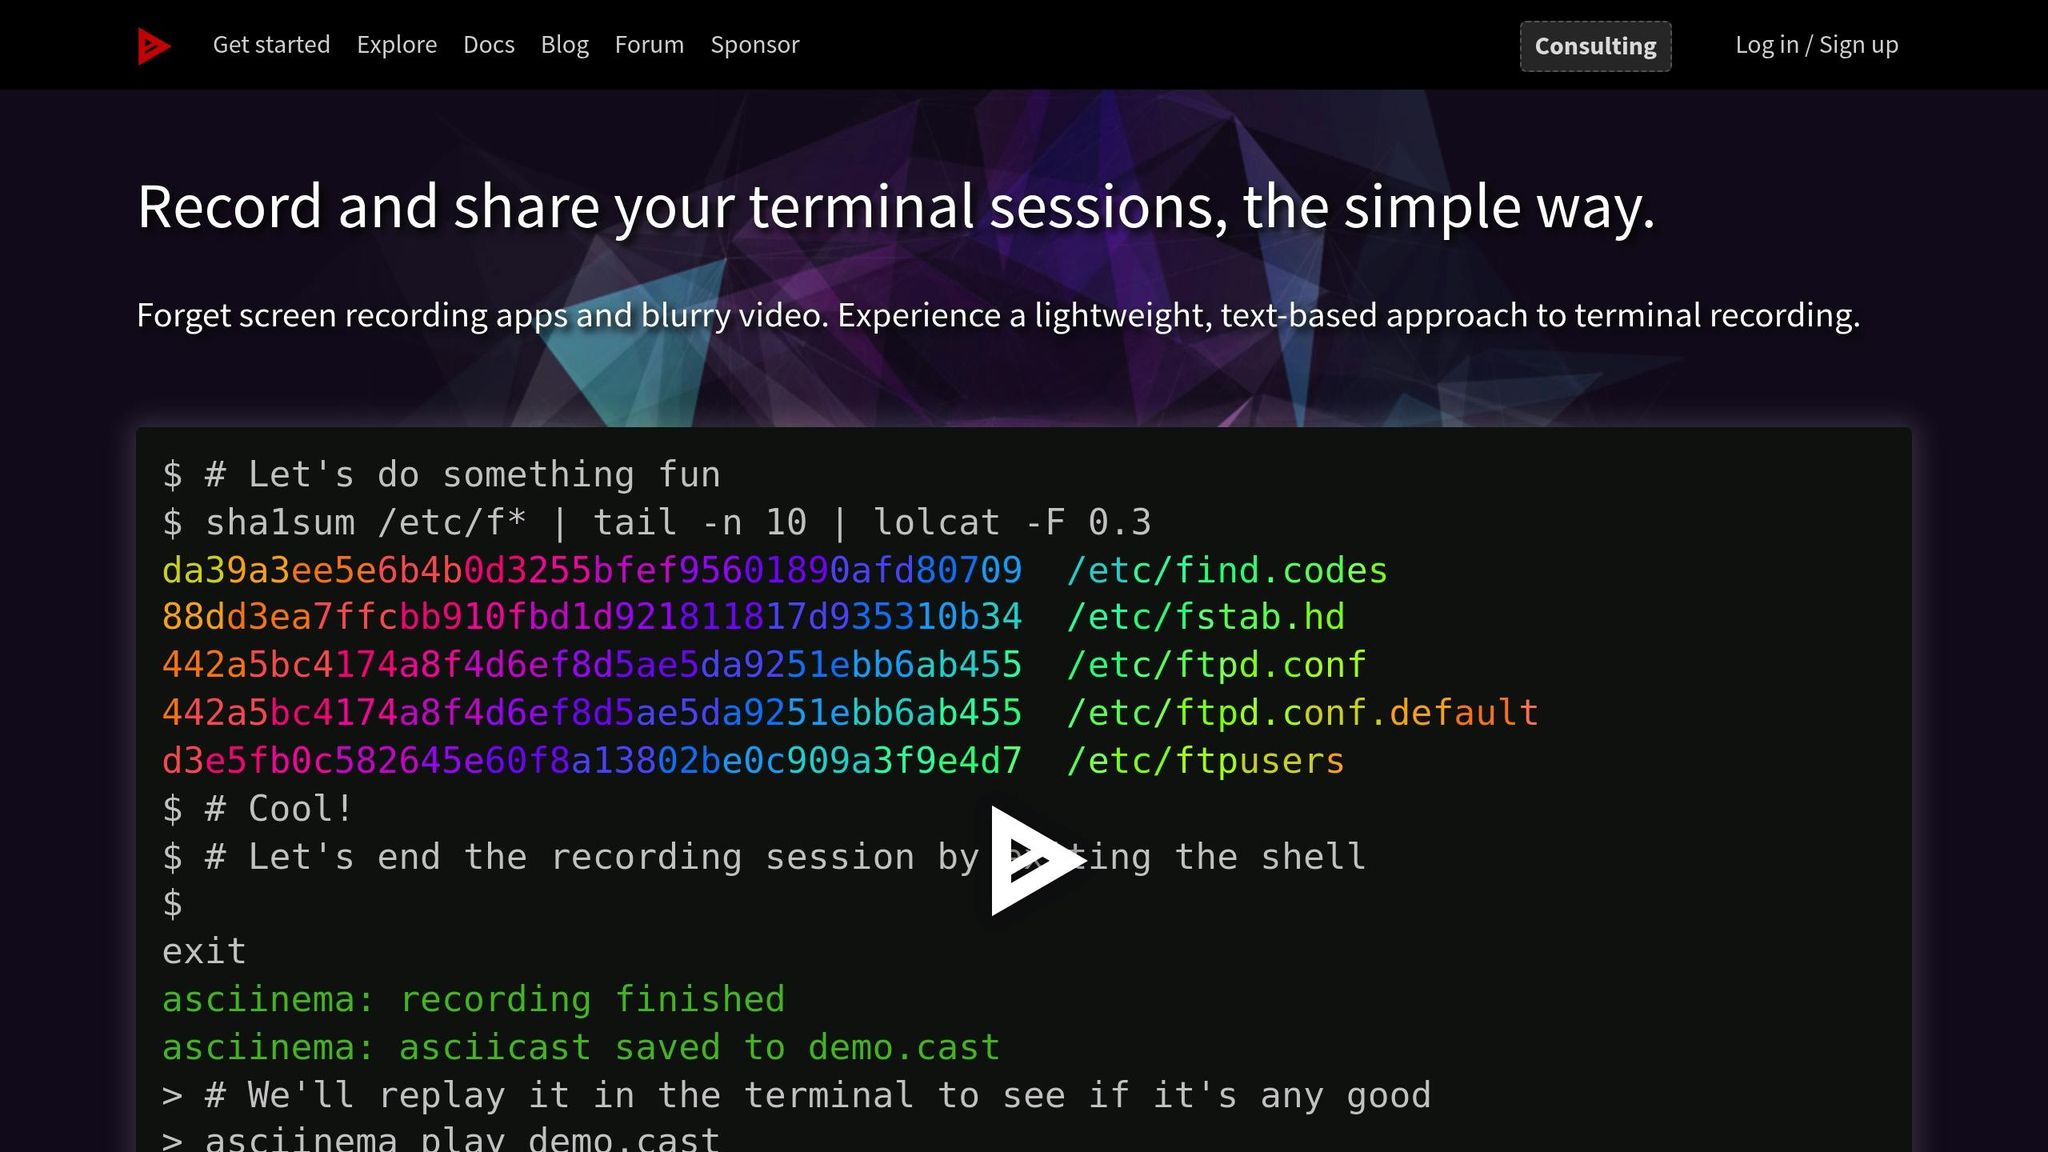
With asciinema, you can record and replay terminal command sequences - whether it's navigating with zoxide or syncing files with rclone. This makes it easier to share your workflows or troubleshoot issues.
asciinema saves sessions as text files, allowing you to document, replay, and share them. Here’s how to get started:
sudo apt install asciinema
asciinema rec demo.cast      # Start recording a session
asciinema play demo.cast     # Replay the session locally
asciinema upload demo.cast   # Publish the session on asciinema.org
Pro tip: Use asciinema to create tutorials that showcase how you use tools like bandwhich, bpytop, and rclone together. These recordings are lightweight, easy to share, and can even be embedded in documentation or linked directly via asciinema.org.
Next up, we’ll dive into analyzing web logs with goaccess.
10. goaccess: Log File Analyzer
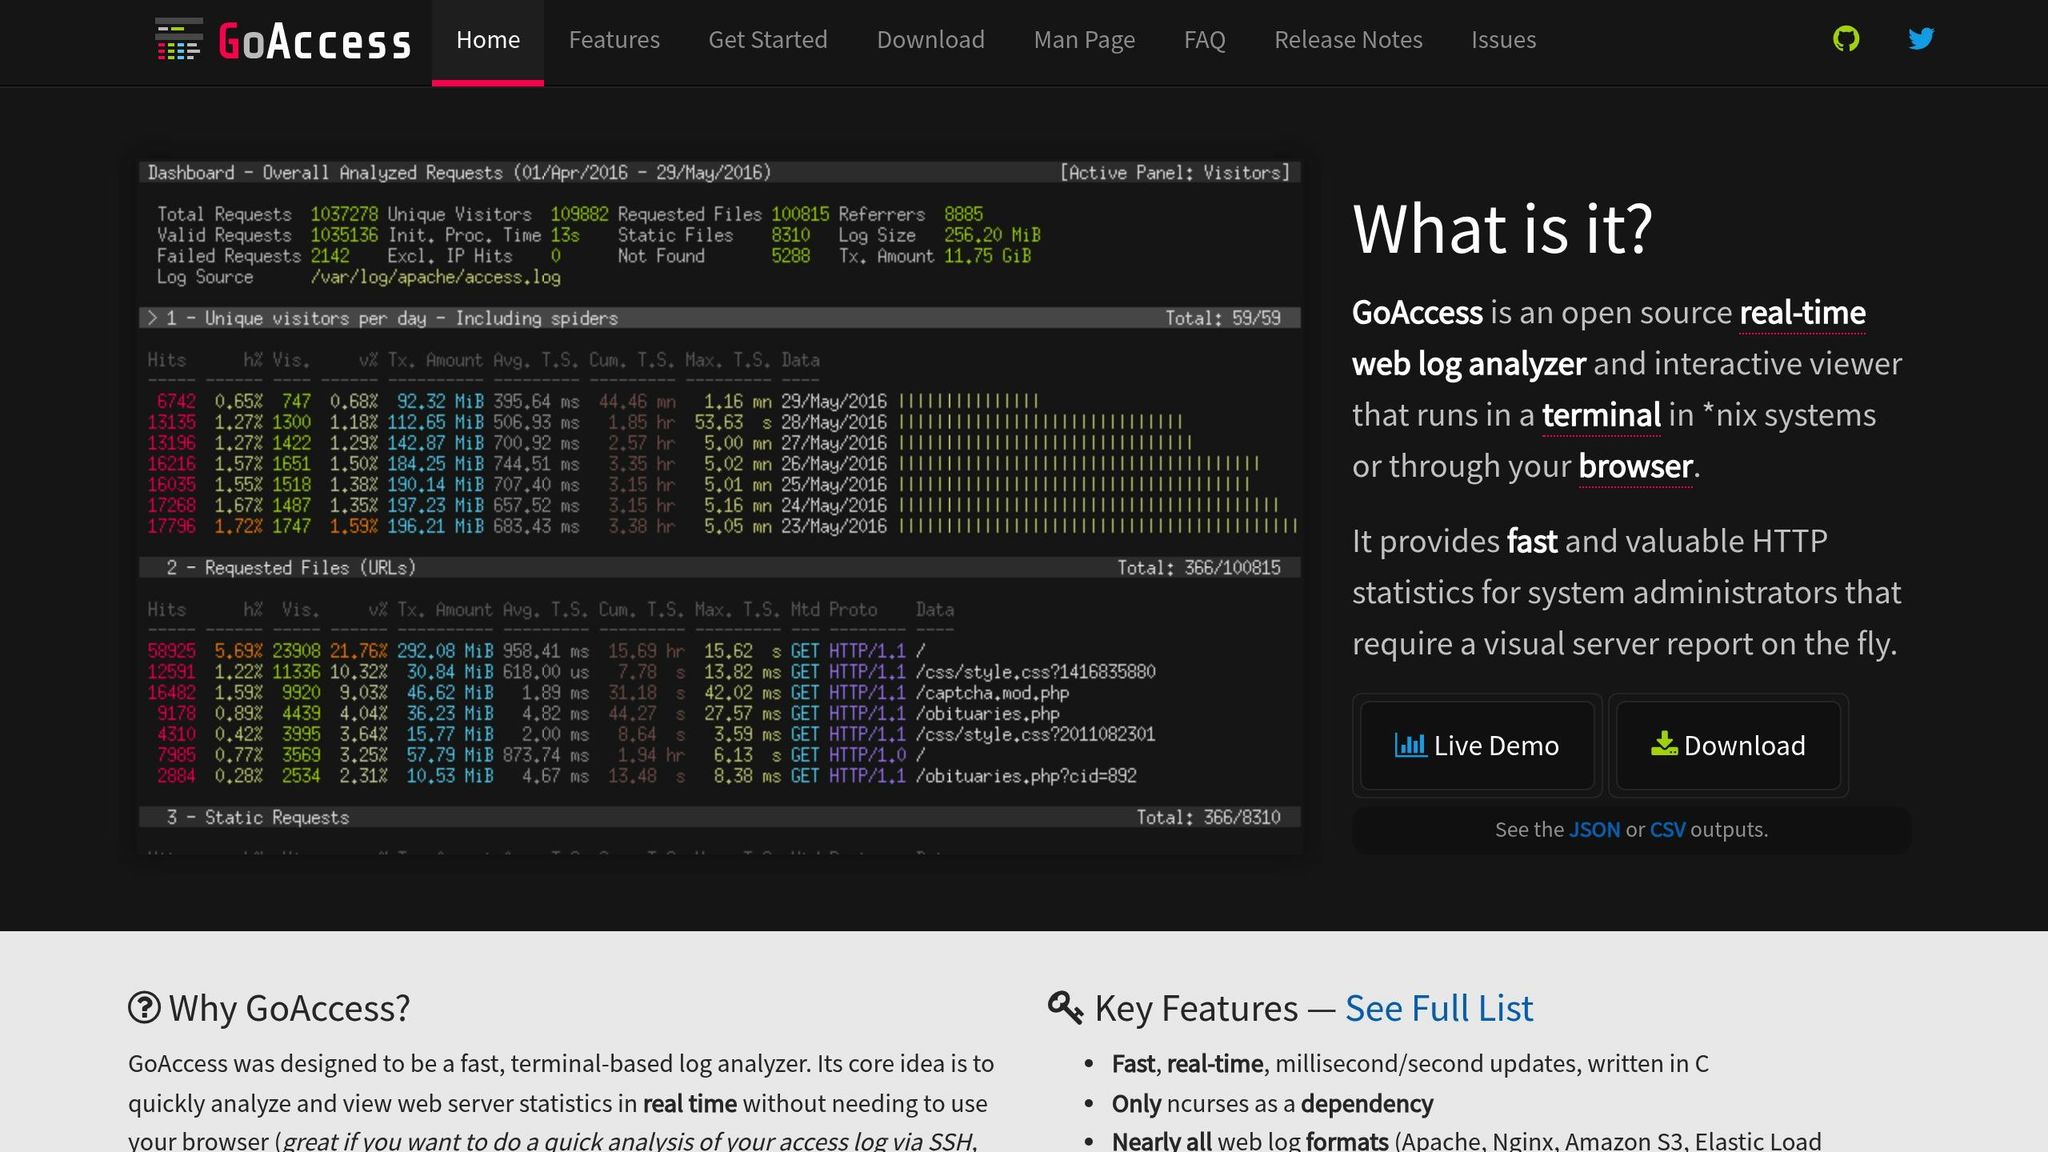
GoAccess is a powerful tool for analyzing web server logs directly in your terminal. It processes Apache and Nginx access logs in real time, making it a great addition to your monitoring tools. Plus, its local-only processing complies with European data privacy regulations.
Key Features
- Generates real-time HTML dashboards with charts and metrics
- Works with Common Log Format, JSON, and custom log formats
- Built with a lightweight C implementation for efficiency
- Includes user-configurable filters and geo-location lookups
Quick Start
Here's how to install GoAccess and create a live report:
sudo apt install goaccess
goaccess /var/log/nginx/access.log \
  --log-format=COMBINED \
  --real-time-html -o report.html
You can also pipe its output to LogCentral to combine live traffic data with centralized log insights.
Up next, speed up your file downloads directly from the terminal using aria2.
11. aria2: Download Manager
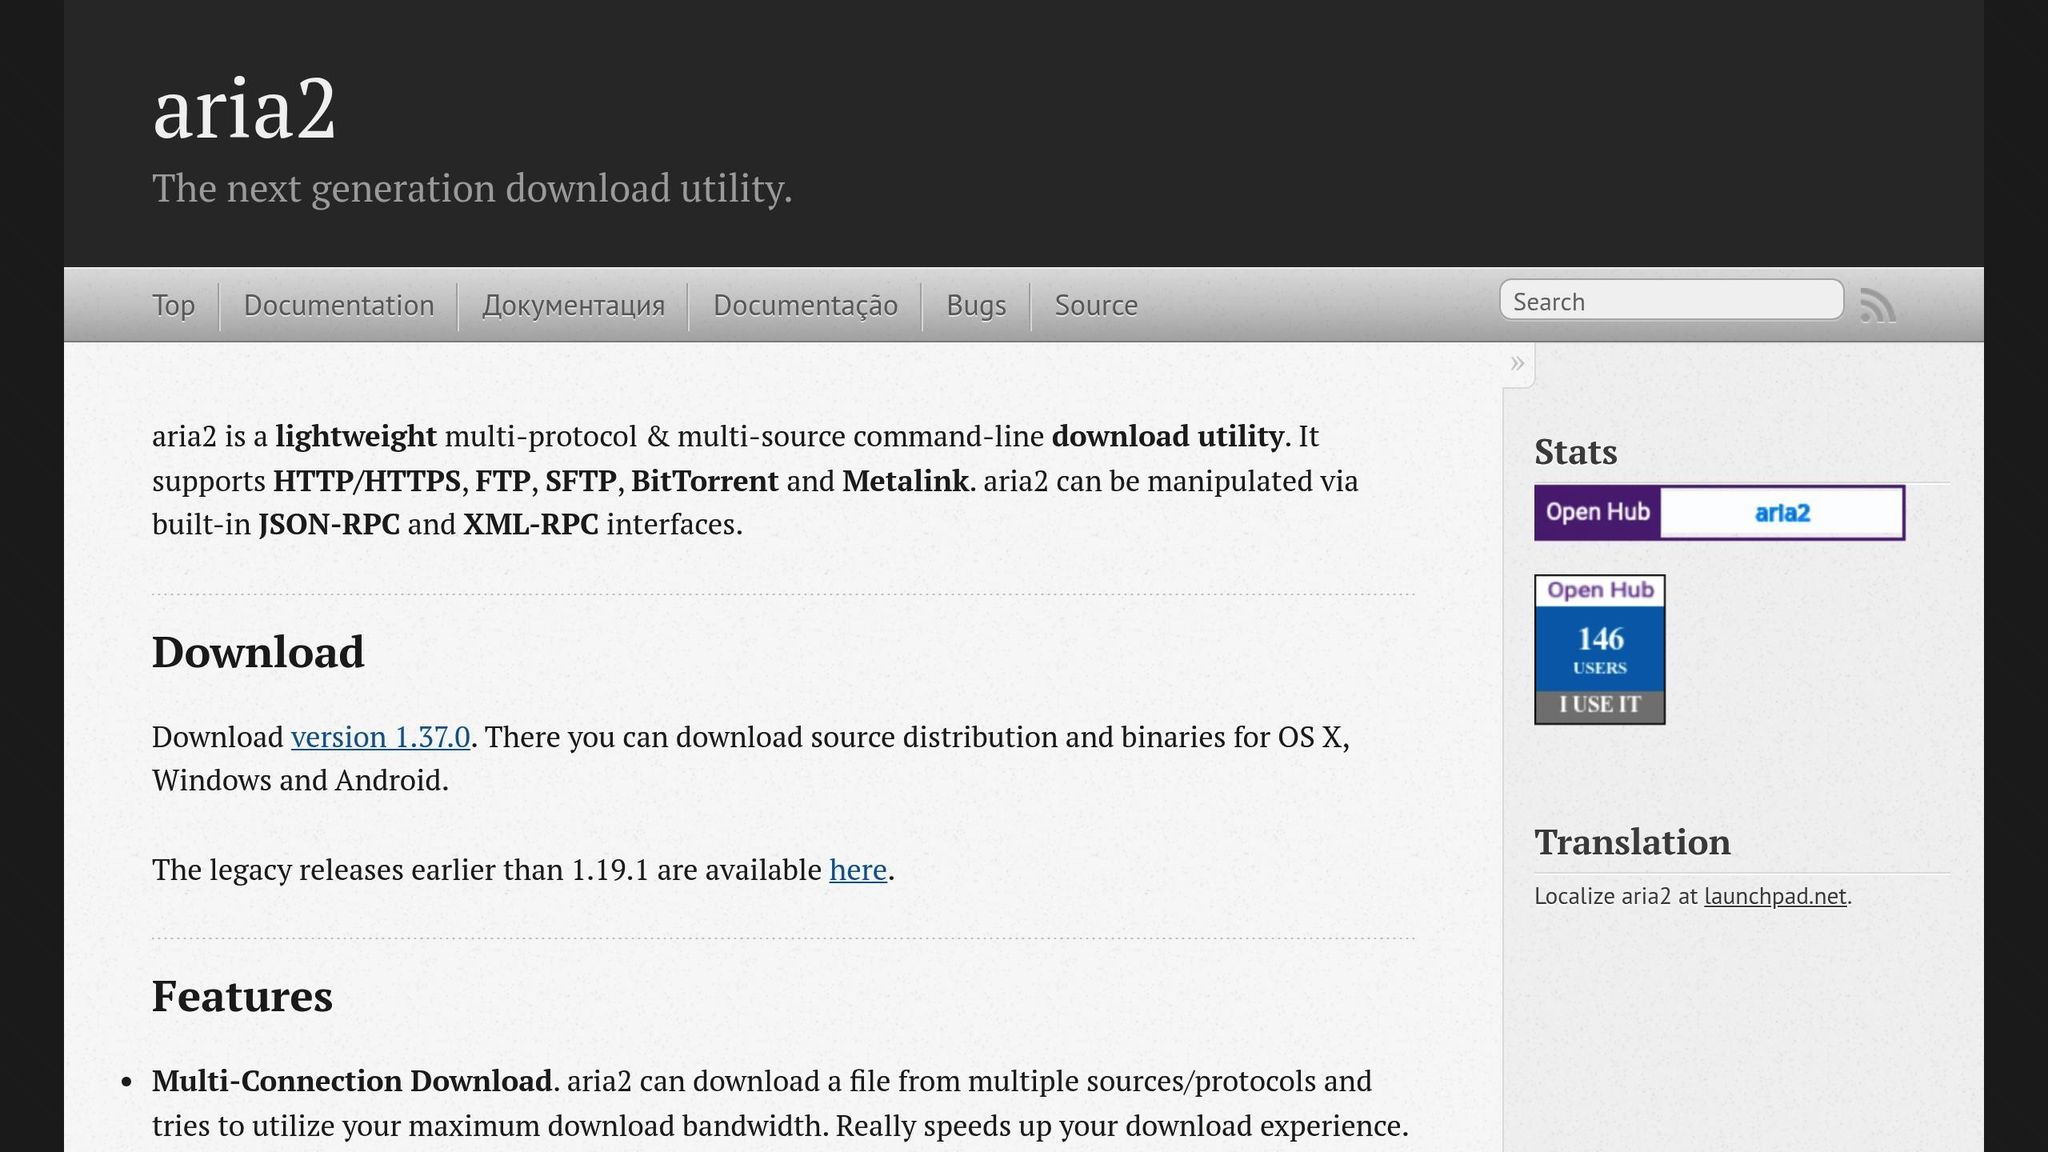
Once you've reviewed your logs using goaccess, you can boost file download speeds with aria2. This lightweight download manager increases efficiency by splitting files into segments and downloading them from multiple sources at the same time. Its simple design and broad protocol compatibility make it suitable for everything from straightforward downloads to handling torrents.
Key Features
- Supports multiple protocols, including HTTP/HTTPS, FTP, BitTorrent, and Metalink
- Downloads files in segments with adjustable connection settings
- Includes built-in support for BitTorrent and Metalink
- Offers a JSON-RPC interface for remote management
- Verifies file integrity with automatic checksum checks
- Allows resuming downloads if interrupted
Quick Start
To install aria2, run:
sudo apt install aria2
To download a file using multiple connections, use the following command:
aria2c -x 16 https://example.com/large-file.iso
If you want to keep an eye on download performance, configure aria2 to generate detailed logs. For example:
aria2c --log=aria2.log --log-level=info https://example.com/large-file.iso
For larger setups, integrate aria2's logging with LogCentral. This setup helps you track download metrics like speed, connection stability, and error rates, ensuring smooth operations across your network.
Tool Features Comparison
Here's a breakdown of tools based on their tasks:
System Monitoring Tools
- bpytop: Tracks CPU, memory, disk, network, and processes. Features a game-like interface with mouse support and works with LogCentral metrics [2].
- glances: Monitors CPU, memory, disk, and network with a lightweight text-based interface.
Network Analysis Tools
- bandwhich: Displays per-process bandwidth usage, connection details, and hosts in real-time within the terminal [1].
- speedtest-cli: Runs download, upload, and ping tests with a simple text output.
File Management & Navigation
- zoxide: Allows quick directory navigation with fuzzy matching and integrates with LogCentral audit logs [3].
- dua-cli: Provides a detailed breakdown of disk usage.
- rclone: Synchronizes data across multiple cloud providers.
Logging & Recording
- goaccess: Generates real-time HTML reports from server logs and connects with LogCentral analytics.
- asciinema: Records and shares terminal sessions as easily shareable casts.
Note: Tools like bpytop, with its Python-based interface, may use more memory compared to lighter options like zoxide or bandwhich.
For a unified experience, consider integrating these tools with LogCentral. It simplifies monitoring and enhances productivity.
Summary and Integration Tips
Here’s how to make the most of CLI tools when paired with LogCentral for smoother monitoring, analysis, and navigation. After reviewing their features, follow these tips to integrate them effectively.
Best Tool Pairings
Use bpytop for an interactive view of system resources alongside bandwhich for live network analysis. This combo helps you link CPU, memory, and disk usage to specific network connections, making it easier to pinpoint performance issues.
How to Integrate with LogCentral
- Forward goaccess reports to LogCentral for real-time summaries and secure, GDPR-compliant storage.
- Send glances metrics to LogCentral to enable continuous monitoring and timely alerts.
- Leverage zoxide history in your scripts to quickly access log directories.
Quick Tip: Add aliases to your .bashrc or .zshrc files to open a split terminal pane running bandwhich and bpytop side by side. This setup allows you to monitor resources instantly.
FAQs
How can I use these Linux terminal tools with LogCentral to enhance monitoring?
Currently, there isn't specific guidance available on directly integrating these Linux terminal tools with LogCentral. However, many of these tools, such as Glances, bpytop, or goaccess, can complement LogCentral by providing detailed system metrics, network insights, or log analysis that you can manually incorporate into your monitoring workflows.
For advanced integration, you could explore exporting data from these tools (e.g., logs or reports) and uploading them into LogCentral, depending on the platform's import capabilities. This approach can help you centralise and enhance your monitoring efforts.
What are the unique use cases where each of these Linux terminal tools shines?
Each tool is designed to excel in specific scenarios, making your Linux terminal experience more efficient and enjoyable:
- zoxide: Perfect for quickly navigating your file system by remembering frequently used directories and allowing you to jump to them with minimal typing.
- bandwhich: Great for monitoring network bandwidth usage, helping you identify which processes or connections are consuming the most data.
- bpytop: Ideal for tracking system performance, providing detailed stats on CPU, memory, disk usage, and active processes in a visually appealing interface.
These tools are particularly valuable for users who want to streamline their workflows or gain deeper insights into system performance, all while working within the terminal environment.
What do I need to install and use these Linux terminal tools effectively?
To get started with these tools, ensure you meet the following requirements:
- zoxide: Install the binary and configure it in your shell. For optional features like completions and interactive selection, make sure you have a compatible version of
fzf. - bandwhich: On Linux, elevated privileges are required (use
sudoorsetcap). On Windows, you may need to installnpcap. - bpytop: Requires a terminal supporting 24-bit truecolor, a UTF8 locale, and a Unicode-compatible font. You'll also need Python 3.7+ and the
psutilmodule (v5.7.0 or higher).
Each tool may have additional optional features, but these are the basics to get you up and running efficiently.