
Top 10 best free syslog servers
Top 10 best free syslog servers
Looking for the best free syslog servers? Here’s a quick rundown of the top 10 tools to centralize and manage your log data effectively. These solutions are critical for real-time monitoring, troubleshooting, security analysis, and meeting compliance standards - all without breaking the bank.
Quick Summary of the Top 10 Free Syslog Servers:
- Logstash: Part of the Elastic Stack, great for data processing but requires integration with visualization tools like Kibana.
- Graylog Open: Self-managed, scalable, and includes a built-in dashboard for visualization.
- FluentD: Open-source, plugin-based, and ideal for distributed systems.
- Syslog-ng Open Source Edition: Handles multiple input formats and offers strong security features.
- Grafana Loki: Lightweight, label-based indexing with seamless Grafana integration.
- SigNoz: Unified observability tool combining logs, metrics, and traces.
- NXLog Community Edition: Lightweight and flexible with strong filtering and event correlation.
- FastVue Syslog: Windows-based, simple, and focused on log storage and archiving.
- Nagios: Primarily a monitoring tool with basic log analysis features.
- Kiwi Syslog Server Free Edition: Designed for small setups with a 5-device limit.
Choosing the Right Tool:
- Need scalability? Go for Graylog or SigNoz.
- Prefer simplicity? FastVue or Kiwi Syslog Server is a good fit.
- Looking for advanced processing? Logstash or FluentD are solid options.
Quick Comparison Table:
| Tool | Key Features | Best For | Limitations |
|---|---|---|---|
| Logstash | Data pipelines, 200+ plugins | Complex data processing | No built-in visualization |
| Graylog Open | Built-in dashboard, real-time search | Large-scale log management | Requires internal resources |
| FluentD | Plugin-based, buffering | Distributed systems | Needs extra tools for analytics |
| Syslog-ng | Multi-format inputs, TLS security | Secure, multi-source environments | Scaling storage can be tricky |
| Grafana Loki | Label-based indexing, LogQL | Grafana/Prometheus users | No full-text search |
| SigNoz | Logs, metrics, traces in one tool | Unified monitoring | Self-hosting required |
| NXLog CE | Lightweight, flexible outputs | Small systems, SIEM integration | Limited support |
| FastVue Syslog | Text-based logs, SHA256 validation | Windows environments | Basic analysis only |
| Nagios | Log analysis, system monitoring | Existing Nagios setups | Limited log features |
| Kiwi Syslog Free | Real-time monitoring, alerts | Small setups | 5-device limit |
These tools cater to a wide range of needs, from simple setups to advanced log processing in large environments. Read on to find the perfect fit for your organization.
1. Logstash
Logstash is an open-source data pipeline tool designed to collect, process, and route log data within the Elastic Stack. With over 200 plugins available [6], it can pull data from various sources - like logs, metrics, and web applications - standardize formats in real time, and send the processed data to multiple destinations.
Here’s a quick look at some of its standout features:
| Feature | Purpose |
|---|---|
| Persistent Queue | Ensures at-least-once delivery of events |
| Dead Letter Queue | Stores failed events for further analysis and retry |
| Pipeline Management UI | Provides centralized control over multiple pipelines |
| Dynamic Scaling | Adapts to traffic surges without needing extra queuing layers |
While Logstash offers powerful data processing capabilities, it doesn’t include a built-in dashboard for visualizing logs [4]. For that, you’ll need tools like Kibana or SigNoz to create interactive visualizations. This means integrating visualization tools is essential for more complex workflows.
Logstash’s complex pipelines require careful monitoring of bottlenecks, resource usage, throughput, and queue status. It can be deployed flexibly - either as a standalone service or as part of a distributed system [4]. Configurations for parsing events and defining fields are crucial to ensure efficient searching and analysis. This flexibility makes Logstash a strong fit for environments that rely on multiple tools working together.
Its ability to handle intricate data transformations makes it a dependable option for managing logs effectively.
2. Graylog Open
Graylog Open is a self-managed log management tool used in thousands of deployments globally. Licensed under SSPL, it offers powerful log handling capabilities without any cost.
Its strength lies in its flexible data handling system:
| Feature | Description |
|---|---|
| Data Collection | Handles Syslog, GELF, log files, and Windows Event Log inputs |
| Processing Pipeline | Performs real-time parsing, transformation, and enrichment of log data |
| Scalability | Expands horizontally by adding server nodes |
| Integration | Connects to third-party tools via a RESTful API |
| Visualization | Features a built-in web interface with customizable dashboards |
One major highlight of Graylog Open is its ability to handle unlimited log ingestion [2], making it a great choice for organizations managing large volumes of log data. Its real-time log viewing and search tools allow teams to quickly identify and resolve issues.
The platform also includes a built-in web interface with visualization features [4]. This eliminates the need for separate visualization tools, making setup easier and reducing complexity. Its alerting system can notify users of specific conditions, helping monitor critical events proactively.
For output flexibility, Graylog supports destinations like Elasticsearch and Apache Kafka [4]. This adaptability ensures it can integrate smoothly with existing technology stacks.
However, being self-managed, Graylog Open requires internal resources for deployment and scaling. Proper infrastructure planning and ongoing maintenance are essential.
Graylog's pipeline system is especially effective for handling complex log processing tasks. It gathers data from various sources, applies customizable parsing rules, enriches the data, and then stores it [4]. This organized method ensures consistent and dependable log management across the organization.
3. FluentD
FluentD is an open-source data collector, part of the CNCF ecosystem, trusted by over 5,000 companies to streamline logging in distributed systems.
| Feature | Description |
|---|---|
| Data Sources | Accepts inputs like syslog, application logs, and system metrics |
| Output Options | Offers 500+ plugins for destinations such as databases, message queues, and data stores |
| Buffering | Includes a mechanism to prevent data loss during outages |
| Scalability | Supports log collection from 50,000+ servers in its largest deployment |
| Interface | Features a browser-based UI with error viewing capabilities |
FluentD relies on a plugin-based architecture, separating data sources from backend systems. This design makes it simple to adjust logging configurations without interrupting existing workflows. Additionally, its buffering system ensures log data is preserved even during output failures.
"Logs are streams, not files. I love that Fluentd puts this concept front-and-center, with a developer-friendly approach for distributed systems logging." - Adam Wiggins, Heroku co-founder [3]
For visualization, FluentD can route logs to Elasticsearch for analysis with Kibana or integrate with other tools to build custom dashboards. Its filtering and parsing features help preprocess logs, cutting storage costs by keeping only the most relevant data.
"Fluentd proves you can achieve programmer happiness and performance at the same time. A great example of Ruby beyond the Web." - Yukihiro Matsumoto (Matz), creator of Ruby [3]
While FluentD is excellent for log collection and transport, advanced analytics will require pairing it with additional tools.
4. Syslog-ng Open Source Edition
Syslog-ng Open Source Edition is often called the "Swiss army knife of log management" due to its broad range of features for collecting and processing log data.
| Feature | Details |
|---|---|
| Input Formats | BSD syslog (RFC3164), RFC5424, JSON, journald |
| Storage Options | MySQL, PostgreSQL, Oracle, MongoDB, Redis |
| Message Queues | AMQP, STOMP |
| Extension Languages | C, Python, Java, Lua, Perl |
| Processing Features | Real-time parsing, filtering, rewriting, alerting |
One standout feature is its patterndb technology, which helps unify different log formats. This is especially useful in environments with a mix of logging sources.
In terms of performance, even a modest setup - like a 2-CPU/8 GB virtual machine - can handle 15–20 GB of logs daily. For larger, enterprise-level setups, additional hardware is needed to ensure redundancy and reliability.
"The Swiss army knife of log management. With syslog-ng, you can collect logs from any source, process them in real time, and deliver them to a wide variety of destinations." - syslog-ng.com [5]
Security is another strong point. Syslog-ng Open Source Edition is unaffected by vulnerabilities such as CVE-2021-44228, CVE-2021-4104, and CVE-2021-45015 [5]. It also supports secure log transmission using TLS and offers encryption at rest through options like OS-level full-disk encryption or database-level encryption [1].
However, scaling storage as log volumes increase can be tricky. To avoid system overload, organizations need to plan their storage architecture carefully and enforce effective log rotation policies. Ensuring 24/7 availability often requires redundant servers and backups, which can add operational complexity. To address these challenges, automated log rotation, regular updates, and resource monitoring are critical. These hurdles are common with self-hosted solutions, making managed options like LogCentral worth considering.
5. Grafana Loki
Grafana Loki takes a Prometheus-style approach to managing logs. With over 66,000 active users and 12,000 stars on GitHub [8], its design reflects an emphasis on efficiency.
| Feature | Description |
|---|---|
| Indexing Method | Uses label-based metadata for indexing |
| Integration | Works with Prometheus, Grafana, Kubernetes |
| Query Language | LogQL |
| Scalability | Supports horizontal, multi-tenant scaling |
| Log Collection | Promtail |
Loki stands out for its storage-friendly design - it indexes only metadata through labels rather than the full log content. This approach keeps storage requirements low while still handling large volumes of log ingestion effectively.
Promtail, Loki's log collection agent, uses Prometheus' service discovery features. It also allows for labeling, transforming, and filtering logs before they are ingested.
However, this efficiency comes with a limitation: Loki doesn't support full-text search across logs [4]. Instead, queries depend on well-thought-out metadata labels, making planning a key part of its use.
For those already using Grafana or Prometheus, Loki integrates smoothly into existing setups. Its LogQL query language lets you explore logs directly in Grafana dashboards, combining log data with other metrics for a comprehensive view.
Loki also supports alerting through Prometheus Alertmanager, simplifying monitoring workflows. With contributions from over 400 developers, Loki continues to evolve, focusing on simplicity and cost-aware log management. That said, organizations should weigh its metadata-based search limitations against their specific log analysis needs. This highlights the importance of choosing a syslog server that aligns with your operational goals.
6. Signoz.io
SigNoz is an open-source observability platform that combines logs, metrics, and traces into one solution. With over 21,000 GitHub stars and 10 million OSS downloads, it’s a popular choice for developers and engineers looking for a unified monitoring tool [9][7].
| Feature | Details |
|---|---|
| Storage Engine | ClickHouse (optimized for log data) |
| Query Options | Custom query builder, PromQL, ClickHouse queries |
| Data Collection | OpenTelemetry-based |
| Search Tools | Full-text search and instant filters |
| Visualization | Charts, graphs, dashboards |
SigNoz uses ClickHouse to deliver fast log analytics and handle high-cardinality data efficiently [9]. Its performance is matched by flexible deployment options, including Docker, Kubernetes (with Helm), or cloud services [9][7].
"Just deployed SigNoz to an EKS cluster. Still can't believe this is free, everything works like a charm. I am really really impressed with the documentation and dashboard. Still in awe." [7]
What makes SigNoz stand out is its ability to correlate logs, metrics, and traces. This simplifies debugging by removing the need for multiple tools. As Go Frendi Gunawan, a Data Engineer at Ctlyst.id, explains:
"Monitoring done. Thanks to SigNoz, I don't have to deal with Grafana, Loki, Prometheus, and Jaeger separately." [7]
Built on OpenTelemetry, SigNoz avoids vendor lock-in and supports automated troubleshooting and predictive analytics [4]. However, keep in mind that self-hosting means you'll need to manage infrastructure and updates on your own.
7. NXLog Community Edition
NXLog CE is a lightweight log collector designed to operate efficiently, even on systems with limited resources.
| Feature Category | Capabilities |
|---|---|
| Log Sources | Windows Event Log, flat files, syslog |
| Output Formats | CSV, W3C, GELF, JSON, XML, KVP |
| Security | TCP and TLS-based transport, message buffering |
| Integration | ELK Stack, Graylog, Loggly |
This tool handles log processing effectively, offering features like message rewriting, event correlation, and data enrichment. Its filtering and pattern matching make managing logs more efficient.
NXLog CE's configuration is simple and flexible, allowing users to customize it as needed. The source code for GNU/Linux is available, giving developers the freedom to modify it. Additionally, it works well with major SIEM platforms.
However, updates may take longer, and support is limited since the software relies on volunteer maintenance.
Tips for better performance:
- Use TCP with TLS encryption to ensure secure log transmission.
- Enable message buffering to avoid data loss during network issues.
- Stay active on the NXLog Community Forum for updates and troubleshooting advice.
The public contrib repository adds extra functionality through community-created projects, making NXLog CE a competitive choice among free syslog tools. Let’s move on to the next option.
8. FastVue Syslog
FastVue Syslog is a Windows-based syslog server that converts log data into structured text files, making it easy to manage and store.
| Feature | Details |
|---|---|
| Core Functions | Converts syslog to text, forwards logs, provides log statistics |
| Security | SHA256 file validation, automatic archiving for safety |
| Interface | Web-based management console for easy access |
| Integration | API access, works with WebSpy Vantage |
| Storage | Text-based logs with automatic compression |
Logs older than 30 days are compressed and moved to an archive, helping manage storage efficiently while ensuring long-term retention [10].
The server also offers an open-source UI available on GitHub for customization. However, tweaking the interface requires some development skills [10].
Key Benefits
- No usage limits or artificial restrictions
- Automatic archiving with adjustable retention settings
- Built-in log statistics for quick insights
- Easy to deploy and set up
While the text-based storage system is simple and portable, it lacks the advanced search and analysis features of database-driven solutions. This makes it a great fit for environments that prioritize straightforward, Windows-focused log management. For more advanced analysis, users can integrate it with WebSpy Vantage [10].
Pro Tip: Adjust the automatic archiving settings based on your available storage and how long you need to keep logs.
FastVue Syslog is an ideal option for Windows users who want dependable syslog management without the hassle of complicated configurations or setups.
Next, we’ll look at common challenges with self-hosted syslog servers.
9. Nagios
Nagios is a monitoring tool that also handles log management through features like log analysis, system activity tracking, and security event monitoring. Here's a quick breakdown of its capabilities:
| Feature | Description |
|---|---|
| Core Functions | Log analysis, system activity tracking, security monitoring |
| Data Presentation | Summarized, easy-to-read format |
| Processing | Customizable filter scripts for log parsing |
| Interface | Command-line-based interface |
While primarily known for monitoring, Nagios can efficiently analyze log data, providing quick insights into system activity and security events. It simplifies complex log data into clear summaries, which is especially useful for teams that need actionable insights without wading through unnecessary details [4].
Strengths
Nagios allows administrators to use customizable filter scripts, offering precise control over which log entries are highlighted. This ensures that critical events are prioritized.
Limitations
Nagios's log management features are part of its broader monitoring toolkit, which means they may not be as specialized as tools like Graylog or FluentD.
Pro Tip: Use Nagios's filter scripts to focus on critical system events and security issues. This keeps your team from being bogged down by less important log data.
For organizations already using Nagios, its integrated log management offers a convenient way to combine monitoring and basic analysis. However, for teams needing advanced log analytics, supplementing Nagios with a dedicated tool might be necessary. Its command-line interface provides strong control for experienced users, making it a practical option for those already familiar with the platform.
10. Kiwi Syslog Server Free Edition
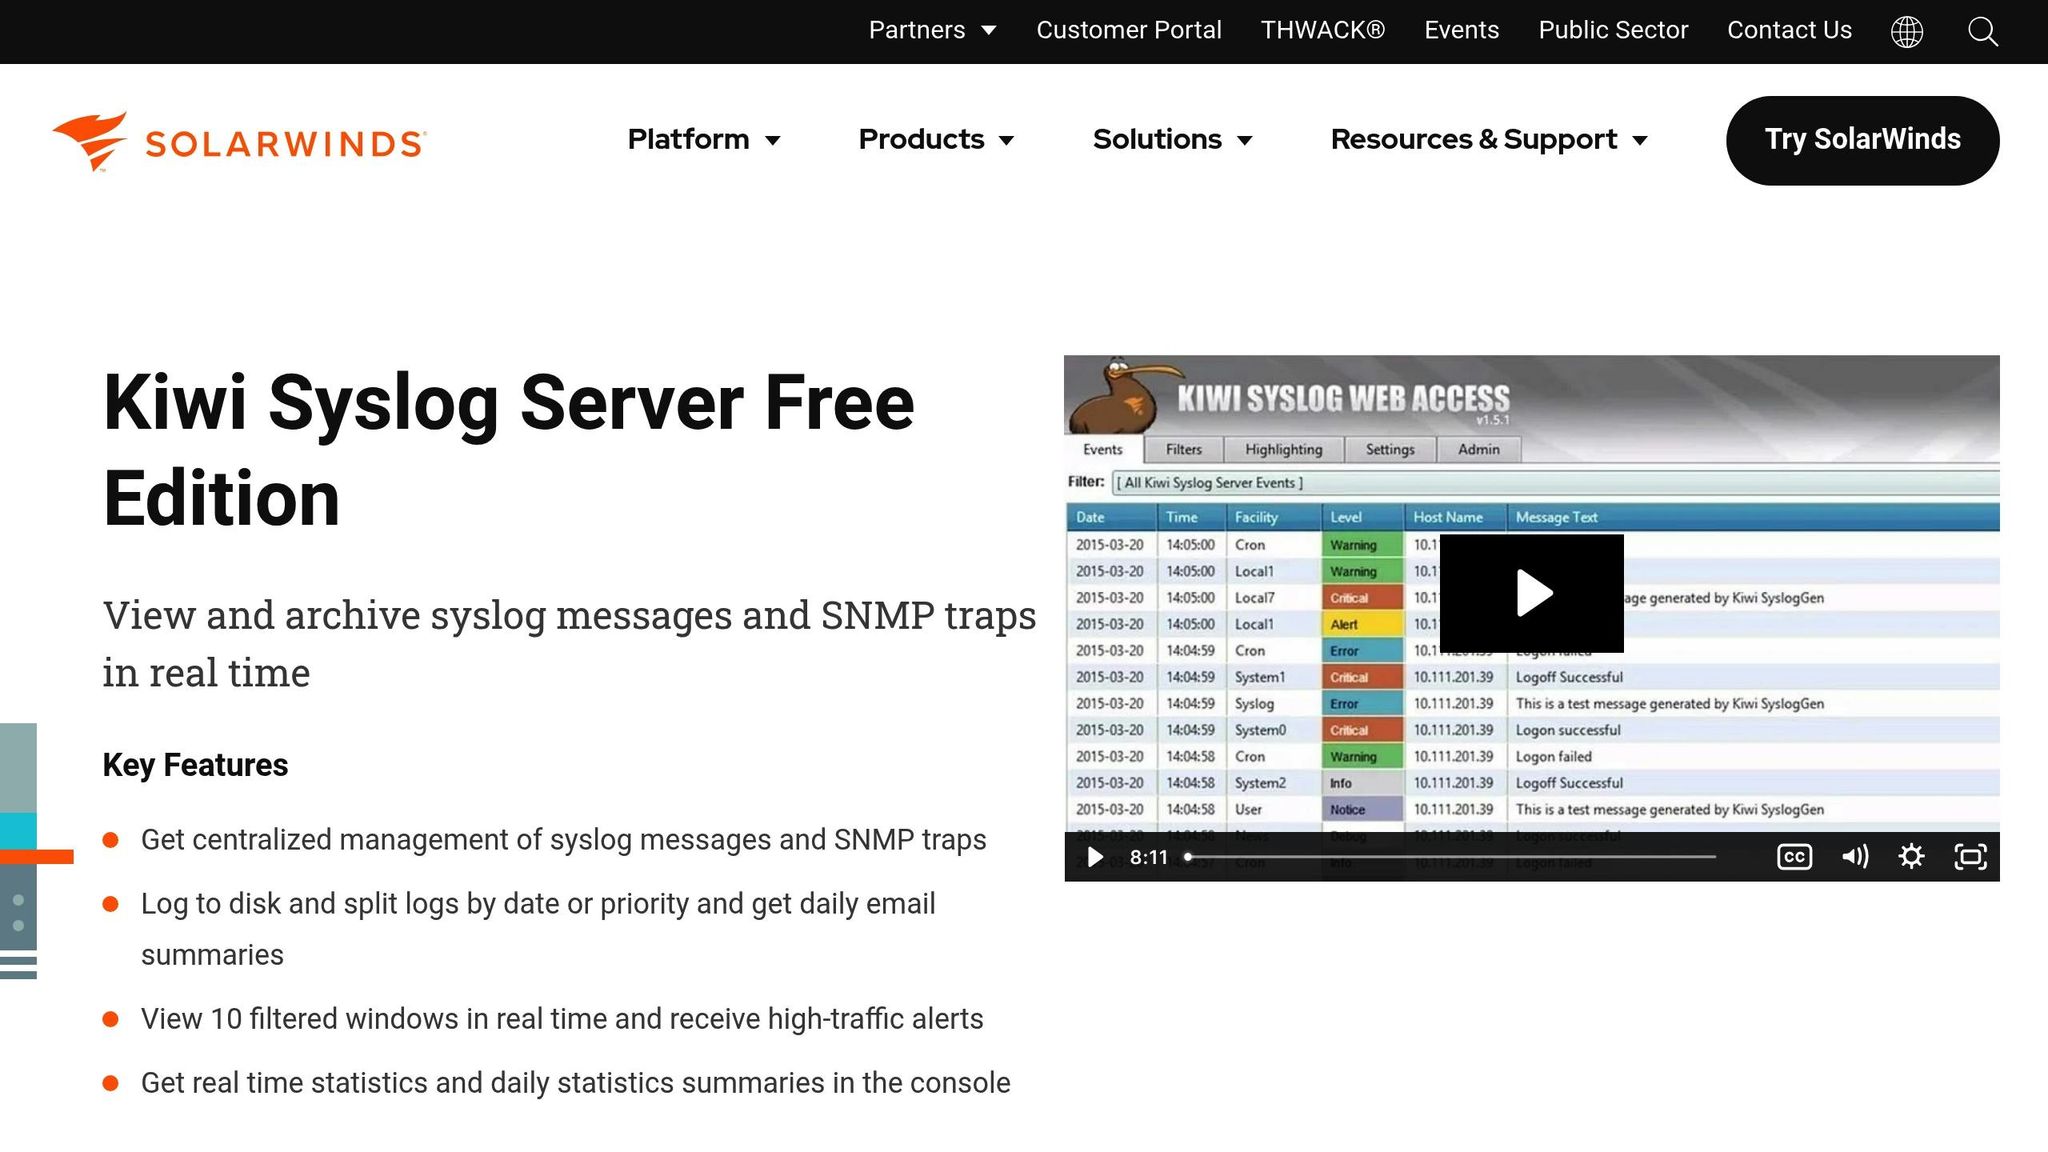
Kiwi Syslog Server Free Edition, created by SolarWinds, offers basic syslog management tailored for smaller setups.
| Feature | Details |
|---|---|
| Device Support | Connects up to 5 devices |
| Real-time Monitoring | Provides 10 filtered windows |
| Log Management | Logs to disk with options to split by date or priority |
| Alerts | Sends notifications for high-traffic events |
| Reporting | Delivers daily email summaries and stats |
| Core Functions | Centralizes syslog messages and SNMP traps |
| Monitoring | Displays real-time data through filtered views |
| Statistics | Generates automatic daily summaries within the console |
Limitations to Consider
The Free Edition does come with some restrictions:
- No web-based configuration
- Limited archiving options
- Lacks database forwarding
- Doesn't include event log or SNMP forwarding features
These limitations highlight some of the challenges tied to self-hosted solutions.
Deployment Considerations
If you’re self-hosting, careful preparation is key. Allocate enough storage, set up retention policies, and secure log data to meet compliance needs [1]. The disk logging feature, which allows splitting logs by date or priority, makes it easier to keep archives organized [11].
Pro Tip: Focus on your five most critical devices to make the most of the tool's device limit.
Kiwi Syslog Server Free Edition is a good match for small teams or testing purposes. However, if your organization is growing, consider whether the 5-device cap will meet your future needs [11]. This tool prioritizes simplicity, which may not suit more advanced requirements.
Self-Hosting Syslog Servers: Common Problems
Free syslog servers might seem like a cost-effective solution at first, but self-hosting comes with its own set of challenges that can surface over time.
Hidden Costs
The upfront expenses of setting up a self-hosted syslog server are just the beginning. A production-grade setup with sufficient CPU, RAM, and storage can cost between $3,000 and $5,000 initially [1]. Add in ongoing maintenance and staffing, and monthly costs can climb to 4–5 times higher [1].
| Cost Category | Monthly Impact |
|---|---|
| IT Staff Maintenance | $150–$300 |
| Downtime Risk | $137–$427 per minute |
These financial considerations are only part of the story - security risks also pose a serious concern.
Security Vulnerabilities
Self-hosted syslog servers are responsible for safeguarding sensitive operational data. If logs are tampered with or destroyed, critical evidence of potential issues could be lost [1]. To mitigate these risks, organizations need robust measures, including write-once systems, cryptographic hashing, encryption (both at rest and in transit), regular security updates, and detailed audit trails.
Scalability Issues
As log data grows, performance can take a hit. For instance, a virtual machine with 2 CPUs and 8GB of RAM can process only about 15–20 GB of logs daily [1]. These limits can become a bottleneck, especially when paired with stringent regulatory requirements.
Compliance Demands
Meeting regulations like GDPR or HIPAA requires advanced configurations. This includes enforcing strict retention policies, implementing granular access controls, ensuring tamper-proof storage, maintaining detailed audit logs, and adhering to geographic data restrictions. These complexities can make compliance a significant challenge.
Operational Burden
Self-hosting requires dedicated IT resources for tasks like updates, monitoring, storage planning, backups, and responding to security incidents. Essentially, managing a self-hosted syslog server is akin to running a small-scale distributed log collection system [1].
For small and medium-sized organizations, this means setting aside 3–5 hours monthly for regular maintenance, plus extra time for emergencies and upgrades. High availability adds another layer of complexity, often requiring redundant servers, load balancers, and geographically distributed log storage [1]. These operational demands are a key reason many organizations opt for managed services, which provide better scalability and reduce ongoing workload [1].
LogCentral: Simple Syslog Management
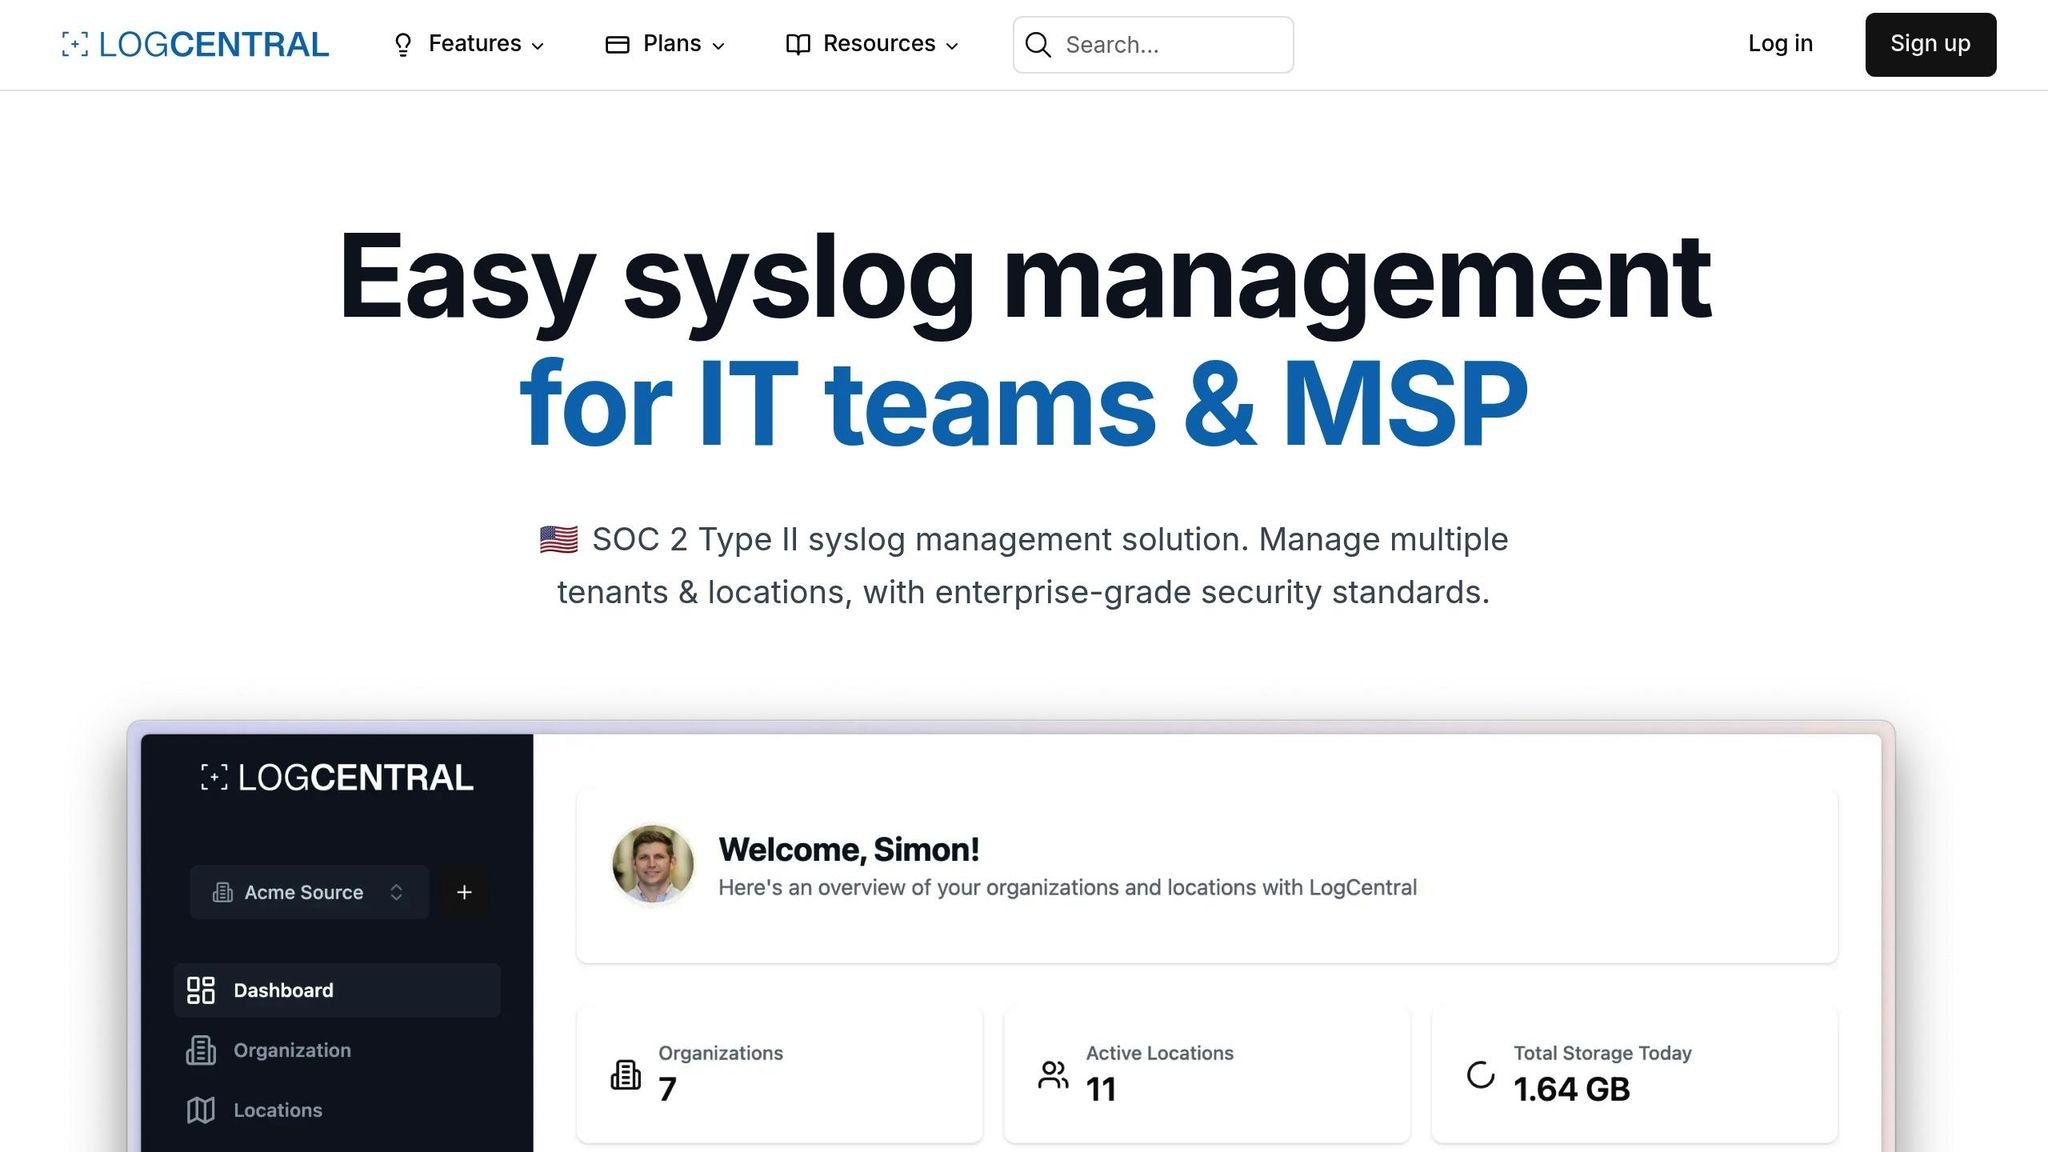
LogCentral provides a cloud-based option for managing syslogs, removing the need for expensive, self-hosted servers. By cutting out the hassle of maintaining infrastructure manually, it solves the common challenges of DIY log management. This managed service approach directly tackles the issues tied to self-hosted solutions.
Flexible Pricing Model
LogCentral uses a pay-as-you-go system, charging only based on log volume. Key benefits include:
- No hardware expenses
- No maintenance requirements
- Automatic scaling
- Integrated storage management
Features Designed for Enterprises
LogCentral is equipped with features tailored for larger organizations, such as:
- Compliance-Ready: Supports GDPR and SOC 2 standards, with retention policies you can adjust
- Reliable Uptime: Built on geo-redundant infrastructure for consistent availability
- Enhanced Security: Encrypts data during transfer and while stored
- Detailed Auditing: Tracks user actions and system changes with precision
Built for Service Providers
LogCentral's design also benefits managed service providers (MSPs). It simplifies managing logs across multiple clients with features like:
- Separate log storage for each client
- Simplified billing based on usage
- A unified management dashboard
- Role-based access control (RBAC) for secure operations
Automated and Efficient
LogCentral automates the tough parts of log management, from scalable storage to compliance and security. IT teams can focus on their main priorities while the platform handles tasks such as live log visualization, 24/7 monitoring, automated firewalling, and intelligent IP management.
"By leveraging LogCentral, organizations get a professional, compliant log management solution that removes complexity and scales effortlessly, far outshining the DIY approach on every front." – LogCentral.io
Summary
Free syslog servers offer powerful customization options but come with clear trade-offs. While they allow for tailored setups, they often involve a level of complexity that can impact performance. Managing data collection and processing effectively requires significant configuration effort.
These challenges also extend to operational costs. As mentioned earlier, self-hosted systems may appear cost-free but often come with hidden expenses, such as hardware management and maintenance. In comparison, cloud-based solutions provide a more streamlined approach.
For instance, platforms like LogCentral address these issues by delivering enterprise-level features without the hassle of managing self-hosted systems. Key benefits include:
- Scalable Storage: No need to worry about hardware or capacity planning.
- Built-in Compliance: Ready to support GDPR and SOC 2 requirements.
- High Availability: Reliable access to your log data at all times.
- Comprehensive Security: Protects data from unauthorized access and tampering.
Deciding between free self-hosted servers and managed solutions ultimately depends on your team's technical expertise, compliance needs, and operational goals.